Action to Implement Management that is Conscious of Cost of Capital and Stock Price
Action to Implement Management that is Conscious of Cost of Capital and Stock Price, updated as of June 19, 2026
Summary
| Analysis of current situation |
- Our cost of equity, estimated using the capital asset pricing model (CAPM), has risen to around 8.9%, due to the rise in long-term interest rates (the estimated cost for FY3/2025 was 7.0%.)
- While the cost of equity is rising, ROE is also increasing (FY3/2026: 12.4%,) so a certain equity spread*1 has been secured.
- Our PBR*2 improved to 2.1x, driven by solid business performance. Although it does not reach the weighted average PBR of 2.4x for the machinery industry on the Tokyo Stock Exchange Prime Market, it exceeds the weighted average PBR of 1.6x for the construction industry.
- While we believe that we have received a certain level of recognition from the market, we need to continue our efforts in order to meet market expectations.
|
| Policies |
- Maintain and increase ROE in excess of cost of equity (FY3/2027: while the target is at least 11.5%, it is projected to reach at least 13.5%, note that it would be at least 11.0% excluding the effect of gains from sale of cross-shareholdings.)
- To achieve the target ROE, we will increase balance sheet efficiency while improving profitability and maintaining a solid financial foundation.
- At the same time, we will promote initiatives to reduce the cost of capital.
|
| Initiatives |
- Steady implementation of the 14th Medium-Term Management Plan to achieve Vision 2030.
(Working especially to maintain and expand our market position in the EPC Business, the source of our recurring revenue model businesses)
- Optimal cash allocation to achieve both our growth strategy and capital efficiency.
- Specification of a quantitative policy on shareholder return.
- Further enhancement of IR activities, including effective dialogue with investors and enhanced disclosure information.
|
- *1 Equity spread = ROE - Cost of equity
- *2 Calculated based on average closing stock price from May 15 to May 29, 2026 and net assets per share as of the end of March 2026
Analysis of Current Situation
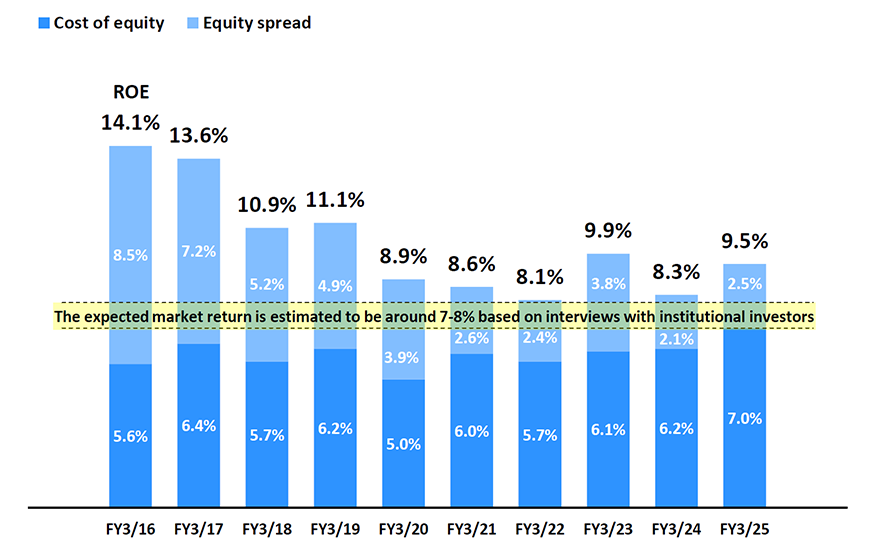
ROE / Cost of equity*3 / Equity spreads over time
ROE has remained above cost of equity, and a certain equity spread has been secured.
- *3 Cost of equity calculated based on CAPM.
Beta values are measured over multiple time periods (weekly 1 year, weekly 2 years, monthly 3 years, monthly 5 years, monthly 10 years), and the median value is used.
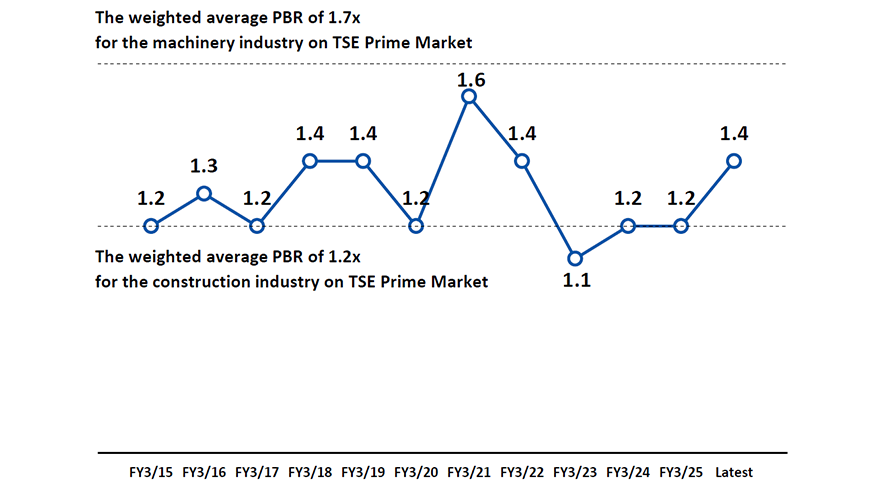
PBR*4over time
Although PBR does not reach the weighted average for the machinery industry on the Tokyo Stock Exchange Prime Market, it exceeds the weighted average for the construction industry.
- *4
- Each year PBR = (Average month-end stock price over 12 months) / (Year-end net assets per share)
- Latest PBR = (Average closing stock price from May 15, 2026 to May 29, 2026) / (net assets per share as of the end of March 2026)
- The weighted average PBR for the machinery industry and the construction industry based on the data as of May 2026 for the "Average PER and PBR by Size and Types of Industry" published by the Tokyo Stock Exchange.
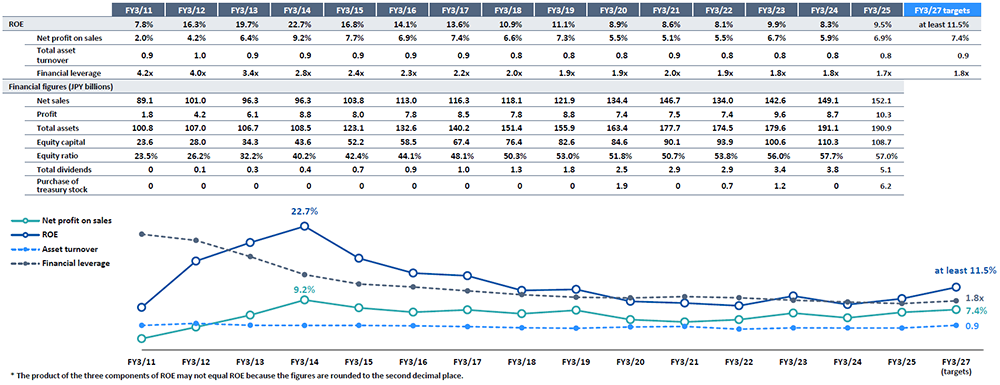
Analysis of ROE (Net profit on sales ×Total asset turnover×Financial leverage)
Over the past 15 years, we have enhanced our equity capital to stabilize management and improve creditworthiness. As a result, financial leverage decreased, and capital efficiency declined. While maintaining our strong financial base, we aim to achieve our target ROE by improving our profit margin on sales.
- *The product of the three components of ROE may not equal ROE because the figures are rounded to the second decimal place.
Policy and Main Initiatives